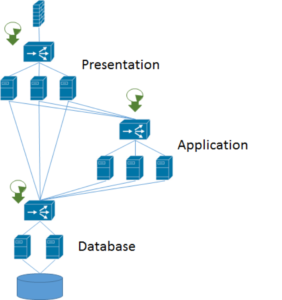
But impact models are a different sort of set of connections than most of us are used to. Consider this three-tier application.
It’s pretty typical of a robust corporate application. Virtual IP addresses for each tier, redundant systems, multiple connections. By the way, the green pie chart-arrow things represent functional application tests, synthetic transactions or errors from an APM integration. In this design, any single server can fail without the application failing completely, and if you have N+1 capacity, without the end users even knowing.
The very simplest way to make an impact model of this application is to add all servers, network functions, and application tests into a single service. With this simple approach, you’ll get immediate notification when an application service is affected by a failure in any of the service elements and in any of the supporting infrastructure - hypervisors, storage arrays, compute nodes, etc.
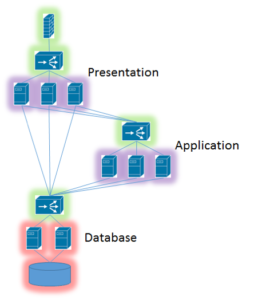
Applications draw as above emphasize the connections between the systems. But when you’re looking at impact you want to think about potential failures and what those would mean to the overall application.
For the application above I see these impact sets:
| Impact Set | Members | Responsible Team |
| Presentation Network Services | Firewall and Load Balancer | Network |
| Presentation Servers | Multiple web servers | Application |
| Presentation Tests | Browser tests | Monitoring |
| Application Network Services | Load Balancer | Network |
| Application Servers | Multiple application servers | Application |
| Application Tests | REST application calls | Monitoring |
| Database Network Services | Load Balancer | Network |
| Database Servers | Clustered Database Server | Database |
| Database Tests | SQL queries | Monitoring |
I added a Responsible Team column. Most large organizations have technical specialist teams and it’s useful to know who should get to work if there is a problem! Your team designations are going to be different than the ones I made up, particularly if the tests are coming in from an APM integration.
Building Your Impact Models
There are multiple ways you can choose to build your impact models based on the impact sets.
There’s the Team First approach, where we group all the components for each responsible team. Team First lets us quickly determine who should work on the problem for fastest resolution.
The application servers in one group, the database servers in another, and all the network services in a third. This is a popular approach, up until you start adding tests. It’s a little hard to figure out where the tests really belong here. Maybe in a fourth group.
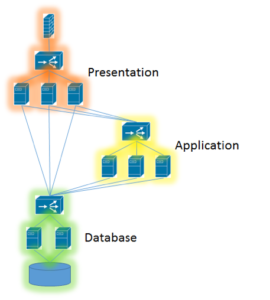
Then there’s the Tier First approach, where we group all the resources and tests for each application tier into one group. Here we quickly spot which part of the application is at fault, and assign a generalist who uses root cause analysis to spot the issue.
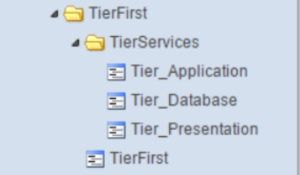
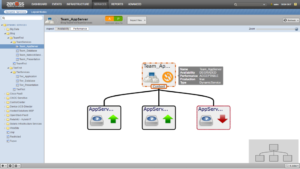
Team First and Tier First are both quick and easy to implement For this application, we define a few focused services, then one application service that ties the rest together. A Tier First service definition would look like the picture below.
Either of these are a great way to get started.
The most comprehensive approach uses three levels of services. This way we can take full advantage of automatic impact policies that properly set application-level problem severity.
Here’s what I mean. If one of the application servers is down, the whole application tier shouldn’t be down, right? We can set a policy that means that a single failure means the service is degraded, not down. It’s still a problem, we still need to fix it, but maybe no one will even notice that there ever was an issue. No reason to come in from the kid’s basketball game for this one!
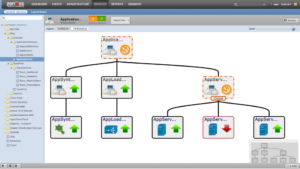
To use the impact policies, we need to create services that group automatically substituted components. Let’s focus in on one tier in the application and create that second layer of services.
The Application Tier now has a Tests service, a Network Services service, and an Application Server service. Looking at the Server service, we can see the effect of a policy - one of the servers is down (the red arrow) but the App Server service and the Application Tier itself is merely Degraded (those orange lightning bolts).
When we add that second tier of impact services, we can apply policies to tune how the state of the application is affected by individual events. We don’t have to lunge and immediately fix a problem affecting a single server. Since we know which application service each server is part of, and the overall state of that application, we can make intelligent decisions about what to work on first.
Zenoss Service Impact lets you focus on application success within your hybrid data center. (Remember, the Live Model works on cloud, virtual, and physical infrastructure) You can define application services in multiple ways to achieve different objectives, and run your overall IT more efficiently.
Request a demonstration and learn more about Zenoss products and solutions.
Join and engage with the Zenoss Community.
