 Several months ago, Mike Lunt, our vice president of engineering, challenged our team to “prove the future.” We were entering the home stretch of executing on a multiyear strategy to disrupt the IT monitoring landscape.
The result: A few weeks ago, we unveiled Zenoss Cloud at our GalaxZ18 user conference to widespread positive reviews. We even did a live demo on stage — which, as risky as it sounds, went smoothly!
One of the features we showcased in that Zenoss Cloud demo was Smart View. Smart View is a rich visualization of your infrastructure’s performance metrics combined with advanced anomaly detection and correlation controls that enable the user to investigate issues more efficiently.
The power of Smart View rests in Zenoss’ relevance engine. Smart View uses this relevance engine to organize your infrastructure's most useful performance metrics in a single pane. This optimized view accelerates your ability to spot trouble in paradise more efficiently than with conventional ITOM tools.
At its core, Smart View is a unique blend of human and algorithmic intelligence that determines how performance metrics or KPIs are displayed. Zenoss Cloud’s deep infrastructure model of your IT landscape enriches the Smart View experience.
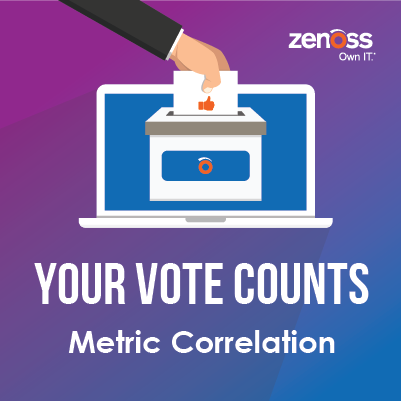
One of the powerful aspects of Smart View is that you and your co-workers — the subject matter experts that know your IT shop the best — can influence Smart View’s relevance engine with a simple upvote or downvote. Upvoting a particular tile tells Smart View those metrics are more valuable in helping your troubleshooting efforts. Tiles that you downvote are ones you consider less significant to accomplishing your task.

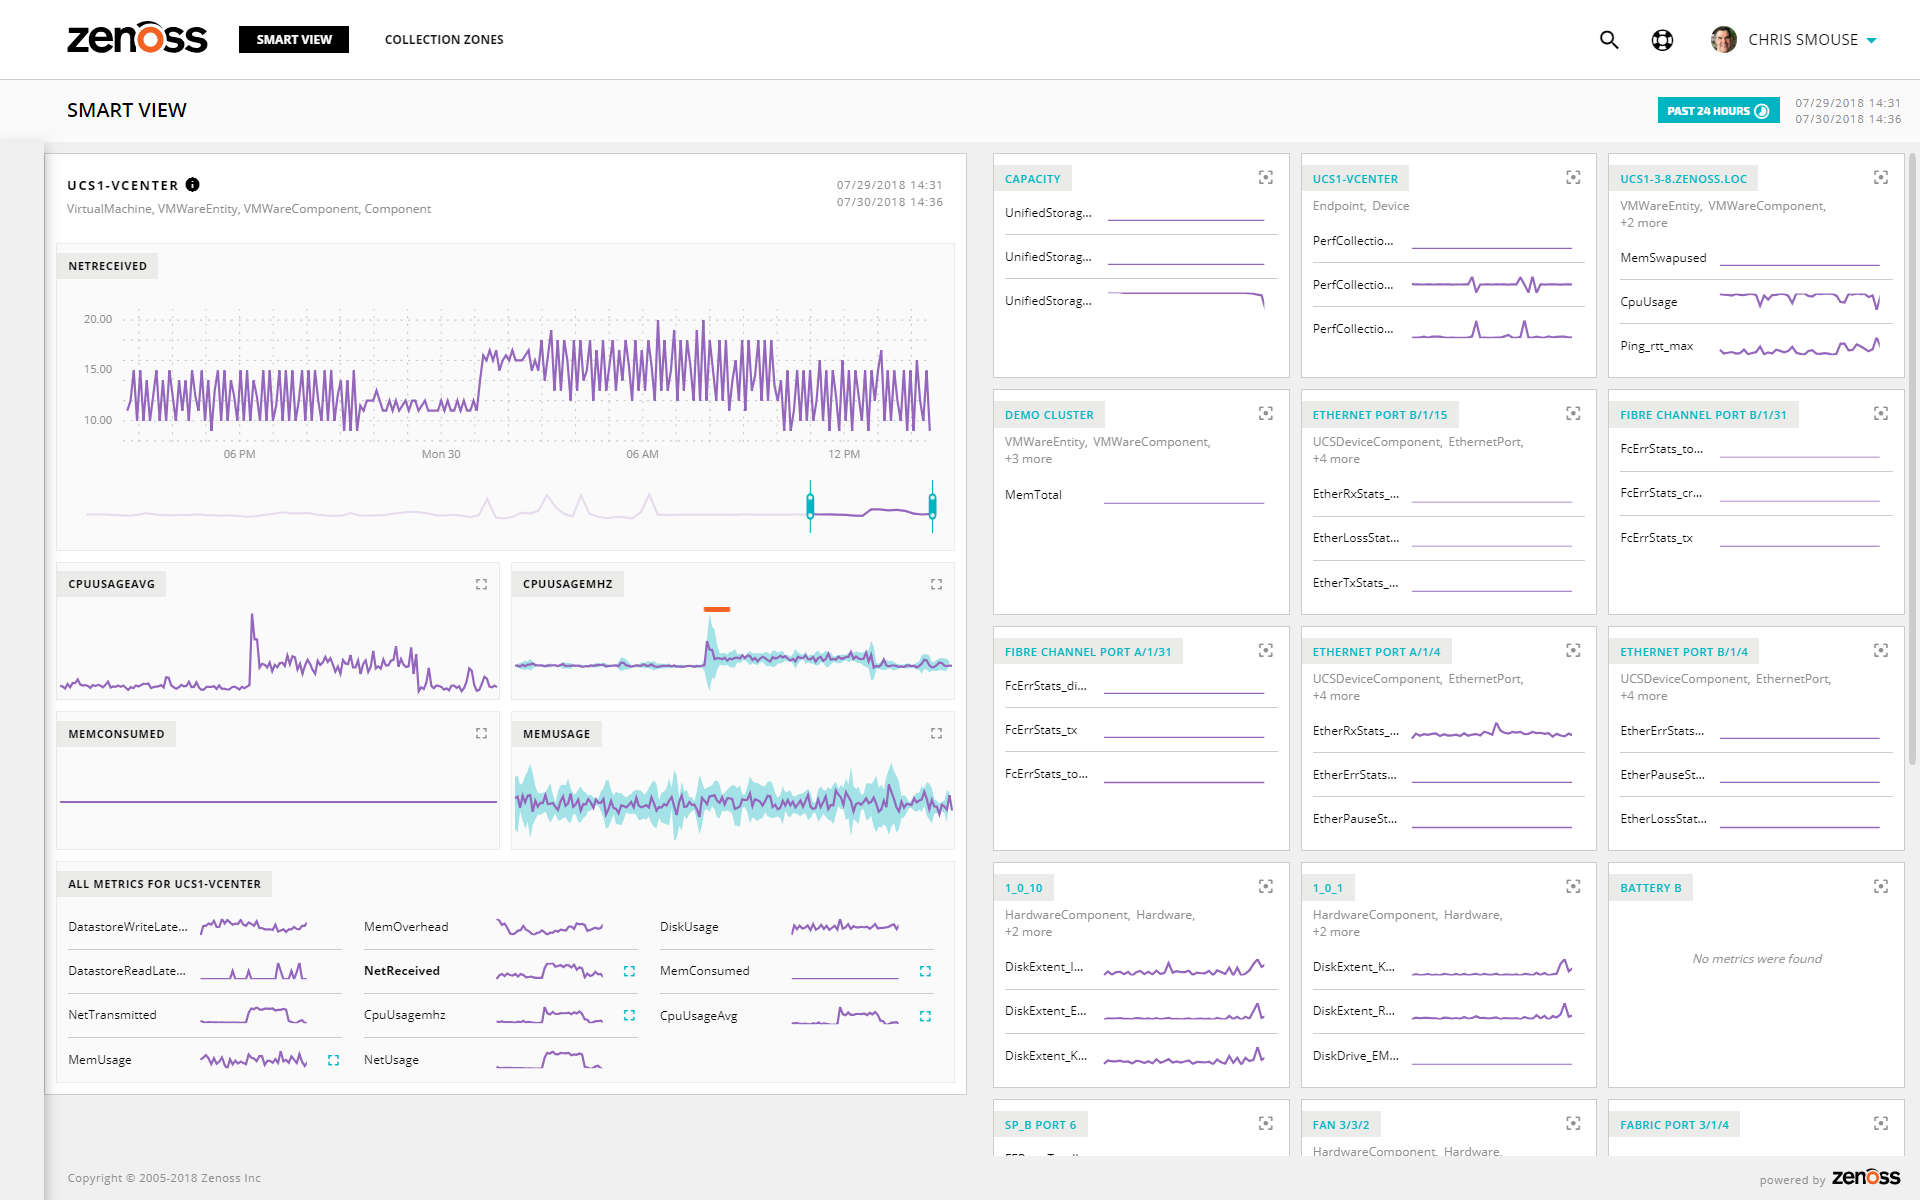
Consider the above Smart View of a vCenter. One of the things we notice is that the CPUUSAGEMHZ metric has an anomaly — indicated by the orange bar on the chart. This might be a metric that you want to consider sooner during a future troubleshooting session. You can simply hover over that chart and upvote the metric. In this example, the anomalous metric is promoted toward the top of Smart View.
By contrast, the MEMCONSUMED metric is a flat line and not that interesting. By downvoting that metric, Smart View replaces it with the next most relevant metric.
As you spend more time using and teaching Smart View, your votes help will also shape your co-workers’ Zenoss Cloud experiences. They will spend less time configuring their own Smart View and more time serving customers.
This combination of machine learning and crowdsourcing — backed by Zenoss’ rich infrastructure model — provides unmatched intelligence in preventing outages. Enabling efficient troubleshooting with metric voting in Smart View is just the first in a series of collaboration features coming soon to Zenoss Cloud.
I’m proud of the work that the engineering team is doing to prove the future with Zenoss Cloud, and we’re excited at the potential of Smart View being a central component of our launch. Power to the crowd!
Want to learn more about how Smart View and Zenoss Cloud can help your organization? Schedule a one-on-one demo today.