
 If you’ve chosen Nutanix Enterprise Cloud, you’re almost certainly relying on Nutanix Prism to help you migrate, then operate, the “enterprise cloud.” There’s no doubt that Prism is an outstanding tool for managing virtual environments.
But — when was the last time someone complimented you on a well-managed virtual environment. Never, right? Because that’s not your job.
For most of IT, the job has changed to: “Provide reliable services built from interoperable components.” And, frankly, the change hasn’t been easy. A recent survey by the Uptime Institute showed that outages have climbed over the past three years, with 48 percent of enterprises reporting significant outages during that time.
Hiding in the server room during an outage is probably not the best approach!
Full-Stack Service Awareness
Our blog from a few months ago set up the need for building a full-stack service monitoring approach that includes all the technologies in your data center. Let’s explore how to merge this new hyperconverged infrastructure into a lean, connected operations workflow. We’ll look at what else you need to monitor, what a unified service view means, and identify three steps to build a well-designed tools chain.
Step 1: Deliver Comprehensive Visibility
Your first step in building a tools chain is listing all your monitoring needs. For example, here are some monitoring requirements identified by another Nutanix customer:
- Incorporate performance metrics and fault events for F5 load balancers
- Check web portal function with synthetic web transactions
- Notify in advance of SSL certificate expirations
- Dig deep into Tomcat Java JMX applications by gathering thread counts, heap memory, and open file descriptors
- Track MySQL database essentials like data and index sizes, open connections and tables, and join statistics
- Support core Active Directory infrastructure by collecting number of connections and sessions, read/write activity, bind times, and cache hit rates
Your list should include internal application details and core infrastructure pieces.
Step 2: Organize for Service Context
 The second step is organizing the incoming data to create context and meaning by defining services. Your operations team will operate more effectively when they understand whether a MySQL database failure is affecting a customer-facing web portal or a long-running internal test system.
A web application is a useful example of a service. One common stack consists of one or more NGINX web servers, Tomcat application servers, and MySQL databases. Create service groups for each application, and you’ll have the context to understand which applications are affected by specific device failures.
Active Directory is an outstanding example of an infrastructure service. Every AD deployment uses several domain controllers to provide continuous authentication availability. Organizations with multiple locations will disperse their directory services around the world, assured that no single location failure will stop this critical service. By delivering service context into the monitoring stack, you won’t need to wake anyone up if just one server fails.
It’s a huge plus if your services include the Nutanix infrastructure that supports each one. Look for a tool that automatically maintains the relationship between top-level service components and underlying infrastructure elements.
Step 3: Automate an Operations Tools Chain
Delivering lean IT means eliminating boring, repetitive manual tasks. Identify how information flows end to end and automate the common use cases, and you’ll eliminate huge amounts of inefficiency.
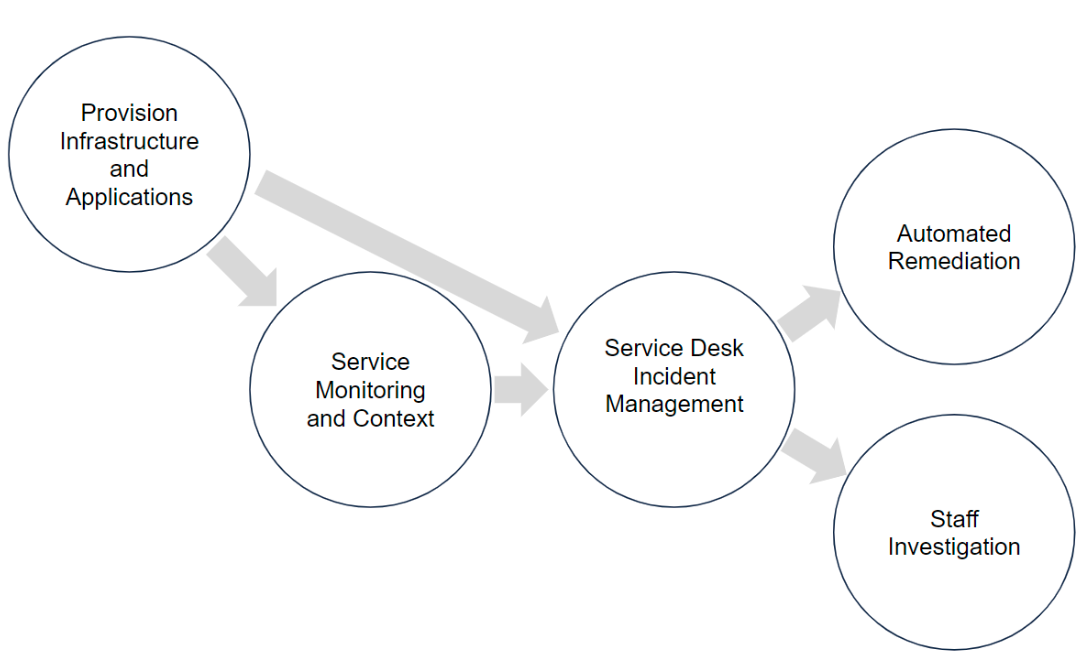
Here’s four integration ideas to get you started:
- Send SNMP traps from Nutanix to your monitoring system for immediate fault awareness.
- Create and update service desk tickets with monitoring events — no more copy/paste!
- Provision new VMs and establish application services at the same time with Nutanix Calm.
- Trigger autoscale up and down with performance thresholds. When a VM hits 90 percent memory, provision another one and tear them down when you no longer need it.
Although this may sound daunting, it doesn’t have to be. Pick the top few tasks, and you can make rapid improvement in just a few sprints.
How did Nutanix build connected full-stack service awareness? They worked with Zenoss.
When the Nutanix customer cited in Step 1 above built out their list of monitoring requirements, they realized they needed a monitoring solution that went beyond the capabilities of Prism. It may surprise you to learn that the customer was Nutanix themselves.

Nutanix needed a tool to meet their team’s needs for connected, full-stack service awareness — and they picked Zenoss. Why?
- They had a business-critical need for insight into application stacks and internals. Zenoss delivers a complete monitoring solution.
- The Nutanix ZenPack extension brought in all the information from Prism, so a team member can rely on one user interface to look at F5 performance, Tomcat application metrics or Prism alerts. No cross-training on a half-dozen tools!
- Zenoss filled all the monitoring, service and integration needs that the Nutanix team identified. Standard extensions provided the base services, and a Python-friendly SDK ensured that Nutanix would be able to handle special cases.
Nutanix and Zenoss enjoy a tight partnership that enables us to help clients get up and running quickly with a fully integrated modern monitoring solution for their hybrid IT environments. If you’d like to get started with scoping a monitoring solution for your organization, please reach out to your Nutanix or Zenoss sales representative today.


