Yesterday I was asked to help a customer to make a memory allocation report for their OpenStack environment. Straightforward problem, right? All we need to know is which instances (OpenStack VMs) are running on which server. I used the Zenoss Analytics reporting package, which means I can get my report without involving developers or DBAs.
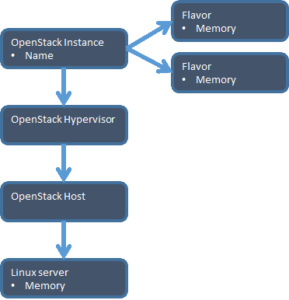
What makes this challenge interesting is that the two values we need to compare are quite far apart in terms of connections through the Zenoss live model.
An OpenStack virtual machine is a running instance composed of a Flavor – the size of the VM, and the Image – the boot image. I needed total memory for all images running on one hypervisor.
Available hypervisor memory isn’t stored in OpenStack at all; it’s in the Linux operating system supporting the Nova host.
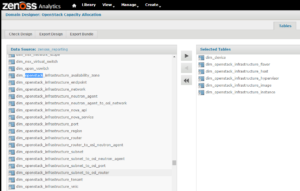
My needs meant I needed to create a new data domain. A domain enables custom connections. Here I added in the tables corresponding to the model elements.
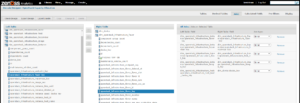
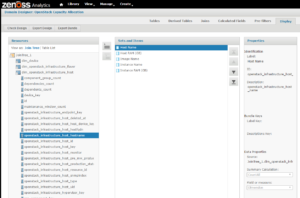
Next step is to define how each of the tables are related, by using joins to identify matching values in different tables.
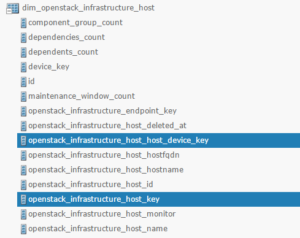
Zooming in, you can see that an OpenStack host has a key for itself, and a key (_host_device_key) that identifies the Linux server where it runs. The model supports multiple connections between elements.
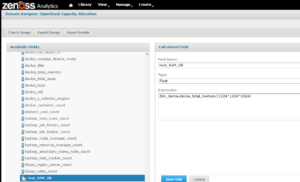
The first time I ran the report I noticed that per-instance memory and per-host were both recorded in bytes. It’s much easier to work in GB, so I created two new calculated fields with division.
Calculated fields are a great way to resolve what call the Furlongs Per Fortnight Problem, where the same metrics on different devices are published in very different units. For example, 128 GB on a Cisco UCS server is recorded as 131,072. That’s 128 x 1024. I’d think it would be 137,439,953,472 for 128*1024*1024*1024, and if I was comparing the Instance memory to the UCS memory I’d need to normalize.
Changing the field Display properties makes my reports easier to build and read. Instead of “openstack_infrastructure_host_hostname” I can just reference Host Name.
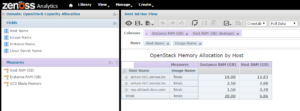
I used Ad Hoc views to test that I had the right data, and organize how I wanted the eventual report to look.
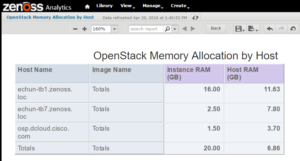
With this report I can identify which of our OpenStack servers have memory available for more instances, and which are full. By the way, OpenStack suggests that you not go over 150% over-commitment on memory.
Common question – can I export this report? Sure, to PDF, Excel, and a bunch of other formats.
I hit my timebox on this report, so didn’t fix the minor issues in the final report. The second report covering allocation of processor cores can be an exercise for you!
Interested in learning more? Enter your email address below to subscribe to our blog!
