
 Monitoring is hard. IT teams are regularly called in to evaluate what’s wrong with an application, a server, an arbitrary component that they’ve never looked at before. Most often there aren’t even any events, just a stream of measurements.
A typical Zenoss customer is measuring half a million data points 12 times an hour, every hour. That’s 150 million measurements a day. No one has time to set 500,000 thresholds, even if they knew what they should be. No one can look through 150 million data points to figure out what might be wrong. How is collecting all that data even useful?
What we’d like is for our system to help us, to look at the data and tell us what might be wrong. Should we trust it unconditionally? No, but some help in spotting what’s unusual would be great.
Identifying unusual conditions, or anomalies, in a data stream turns out to be an interesting problem. For math people, “interesting” means “hard and fun,” so keep that in mind. Why is it interesting?
- More than likely, our data is changing over time. Disks fill up. Application usage grows or shrinks. What was unusual yesterday is normal today.
- With half a million data streams, we can’t manually train our system to teach it what is normal and what isn’t. The system just needs to figure it out itself.
- We need to ignore single extreme values. One measurement spike probably didn’t create a flood of phone calls, after all.
We need an automated assistant that uses common sense to help us understand our data at the time we need it most — during incident analysis. That’s what we’ve tried to build with Zenoss Cloud.
Here’s how it works today.
First, the system will help you understand when our measurements have been irregular.
Lots of variability in a measurement can create a situation where application response time might be good, then bad, then terrible, then good, then terrible. All those differences make people using the application unhappy — and if it’s your website, then they go somewhere else.
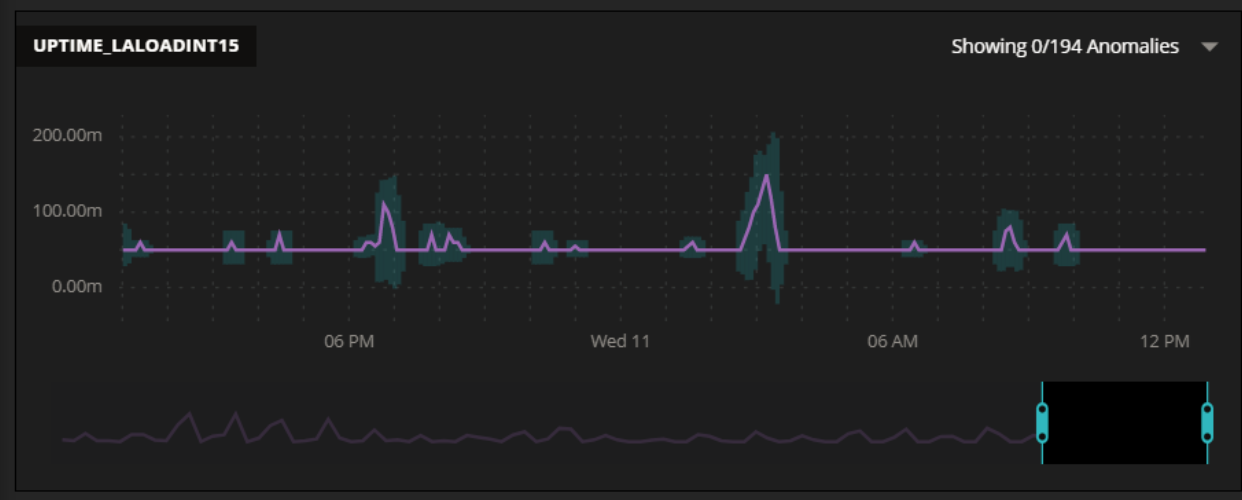
So we generate a moving baseline. It expands when there’s lots of variability, contracts when there isn’t. The diagram below shows an example of this. The purple line is our measurement, and the blue background baseline shows the recent variability. Was there a problem early Wednesday morning? Lots of variability indicates it was an interesting time.
Those baselines are stored in the system as additional data streams, so you’ll be able to export and report on them just as with any other data stream.
Second, we’re using an advanced anomaly detection algorithm to give us automated common sense.
The algorithm has the catchy name “Isolation Forest,” and there’s lots of good reading material on the web. If you like buzzwords, it’s machine learning–guided artificial intelligence. We like it because it’s robust and works well right away.
Robust means that it’s not sensitive to small changes in the data — you’ll feel good about trusting the results. And since it doesn’t need training, it can be applied to any data stream and work well. It’s a good combination.
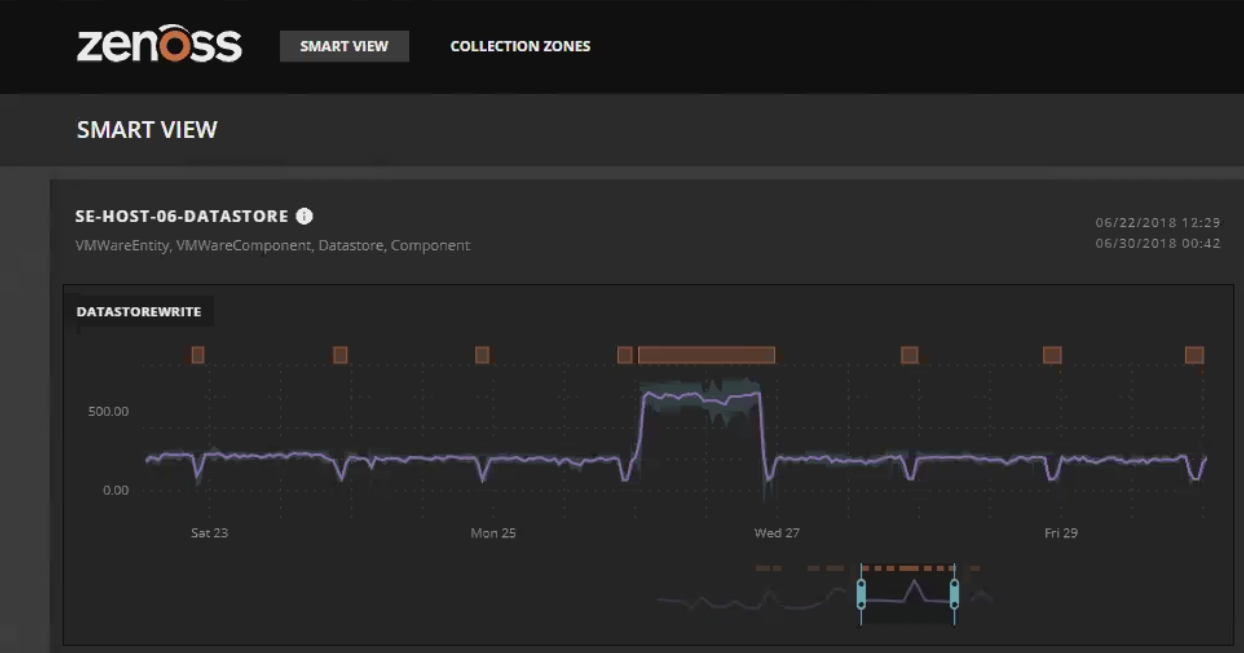
We’re asking the algorithm to look at blocks of time over the past several hours and identify the anomalous conditions. These are stored as tags on the data, not separate data streams. Under the covers, the algorithm sorts the data into a lot of multidimensional trees. Anomalies are identified where the branches of the tree are very short, indicating that the data is far away from rest of the values.
The graph below shows a combined view with orange bars for anomalous conditions along with the moving baseline. I think it’s done a pretty good job at spotting where we should focus, don’t you?
That’s what we’re doing today, but you can expect continued improvements as we learn more.
Need common sense monitoring?
For more on Zenoss Cloud including a walkthrough of its new features, check out this webinar from a couple of weeks ago. If you’ve got a mountain of monitoring data to look through, let us know. We’ll be happy to show you how Zenoss Cloud can work for you.


