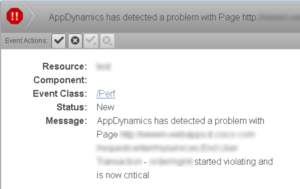
A key source of trouble is that each group has a different view of problems. Developers often rely on application notifications from AppDynamics, Dynatrace, or New Relic while good looking, smart, successful IT operations teams use Zenoss. (It’s true, it’s really true!) Arguing about reconciling the two viewpoints takes time and means customers are kept waiting. Not good.
Automatic Correlation across Applications and Infrastructure?
The dream solution is that application and infrastructure alerts are brought together in one place so that the right team is dispatched the first time to fix an issue. That way no developer wastes time debugging a response time problem attributable to a hardware failure, and no operations team attempts to add compute resources in attempt to correct for an accidentally omitted database index.
Since we published a blog article on a New Relic integration, Zenoss customers have been coming to us asking for help achieving this dream. It turns out it’s a straightforward configuration for most people, no ZenPacks required.
Answers without Code? Sure, mostly!
Over the last week we’ve worked with two large technology companies, one bringing in AppDynamics events and the other events from Dynatrace. Here are the key findings:
- Dynatrace alerts are ready-to-use SNMP traps
- AppDynamics health rule violations are best brought in with a scheduled command script, parsing the results of a REST API call; so yes, you’ll need to do some Python parsing, but no bigee
- (Optional) Consider whether Zenoss event transforms might be usefully applied. More Python, perhaps
- Add a Logical Node to Zenoss impact services to merge APM events to Zenoss infrastructure models
That’s it, no ZenPacks required!
Logical Nodes Merge APM and Infrastructure
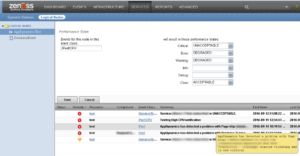
What is a Logical Node, anyway? Simply, it’s a way to associate a stream of events with a particular service, and to tune the event severities to match what’s needed in the service.
The screenshot below shows an AppDynamics example. The Logical node matches all events for the “test” resource, and sets the application status of Unacceptable for events with a Critical state, the status of Degraded for Error and Warning events, etc. No code, that’s nice.
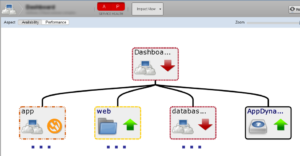
Now all we do is add the AppDynamics logical node to our service. Here, the service is built into three sub-services - web, database, and application, and the AppDynamics logical node. This is one of the models we discussed in our impact model options post. The logical node is added at the top tier, next to our application subservice nodes. That’s a good choice for application-level health alerts. Server- or database-level alerts would be added with additional logical nodes in the appropriate sub-service.
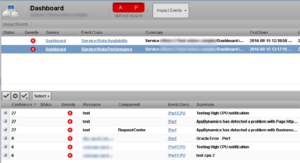
The result is that we have infrastructure and application events included, and ranked, in one view.
The screenshot below shows the results, with a test set of events including both types of issues. With the Service Desk integration, you’ll get a single issue showing the application affected by a problem, and the likely root cause events, making it easy to choose which team to send the issue to first. Their Zenoss console will give them correlated application alerts, helping focus attention on real issues and eliminating wild goose chases.
That was easy...blamestorm avoided!
When we first started looking at APM integration with Zenoss, we found that many customers had figured it out and done it themselves. With what we’ve shared in this post, you can probably see why. APM integration is mostly straightforward connections and configurations, with only a bit of scripting required.
What’s your IT ecosystem? Check out our interactive tool by clicking the button below:
Learn more about Zenoss Products and Solutions
Join and engage with the Zenoss Community
