Everyone in IT knows that our organizations need us to move more rapidly. Application developers are adopting DevOps practices and Agile processes, operations teams are incorporating cloud resources alongside common converged infrastructures, and everyone is automating processes.
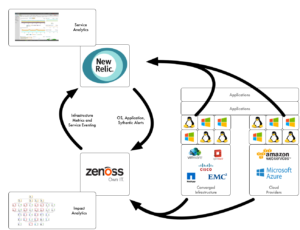
But it’s not enough to get individually faster. We need to collaborate. In this article I’ll show you how we combine application information from the New Relics software analytics tool suite with infrastructure information from Zenoss Service Dynamics to deliver the situational awareness that is critical to delivering great IT customer service.
Integration between Zenoss and New Relic software delivers end-to-end visibility
New Relic Provides Deep Application Performance Visibility
Adoption of New Relic in the application development community has soared. Development teams love the deep insight that the combination of end user experience, application instrumentation, and operating system visibility gives them.
Three key New Relic applications are responsible for much of the value:
- Synthetics – capturing end user response times across a wide variety of devices
- APM – instrumenting applications for internal visibility into bottleneck
- Server – recording key metrics for operating systems
But as we know, issues with the infrastructure supporting the application can produce difficult-to-diagnose performance and availability problems. For example, a stressed load balancer can slow response time with no visible symptoms in the application or operating system. If application teams don’t have infrastructure visibility, they can waste hours and never discover the root cause of an issue.
The Zenoss Model Delivers Accurate Infrastructure Visibility
IT operations teams supporting applications running on cloud and converged infrastructures know how difficult it can be to understand how an application is using resources. Software allows dependencies and relationships to be established on the fly, and change is constant.
A key Zenoss technology is the Live Model that constantly tracks interdependencies across technology stacks. With services provided by Live Model, IT operations teams always work with the as-running description of the IT resources and don’t have to waste time following outdated documentation or discovering connections with manual processes.
But failing or misconfigured infrastructure is only one cause of application service issues. Without a view into the application view of performance, an IT operations team may disappoint a customer by not being able to see or resolve a real application problem.
Application Infrastructure Awareness
It’s clear that both development and operations teams need application infrastructure awareness to provide great customer service. We combined data from New Relic and Zenoss to deliver just that and demonstrated it at FutureStack 15, the New Relic user conference.
You can see the integration working in this video:

We picked Liferay, an open source content management system, to demonstrate. Liferay is a Java application using a MariahDB database.
In the Zenoss labs, we created virtual machines for the Liferay application and database servers, running on our Cisco UCS domain. Since we were already monitoring the VMware and Cisco UCS components, we only needed to build a Liferay impact service to complete the initial monitoring.
To bring in application visibility, we added the New Relic agent to the Linux operating systems and Tomcat server supporting the application and database servers, and configured the New Relic end user experience monitor to collect response time.
At this point we had what many customers have – two separate monitoring systems, one for operations and one for development. Time to integrate!
New Relic provides a straightforward web API that gives access to their event stream. We added an extension to our Zenoss system to pull New Relic events and publish them into the Zenoss event workflow. Monitoring the Linux operating systems with New Relic gave us the key information we needed to link the two data streams.
Application events from New Relic enhance the Zenoss service model
We completed the integration by using the logical event source component of Zenoss service impact. This added the application events from New Relic into our existing infrastructure service.
Value: Eliminate False Starts and Deliver Great Service
There’s nothing like that “the application is slow” call. How do you know where to start?
When a service desk takes the call, they have to guess who’s going to get it. When they guess wrong we can waste hours looking for an application issue that is hiding in the infrastructure, or for an infrastructure issue that would be straightforward to spot if only we were looking there.
By combining application and infrastructure data in one interface, we can eliminate that common problem and deliver better response in problem situations.
