Impact of High Cardinality in Operations Management
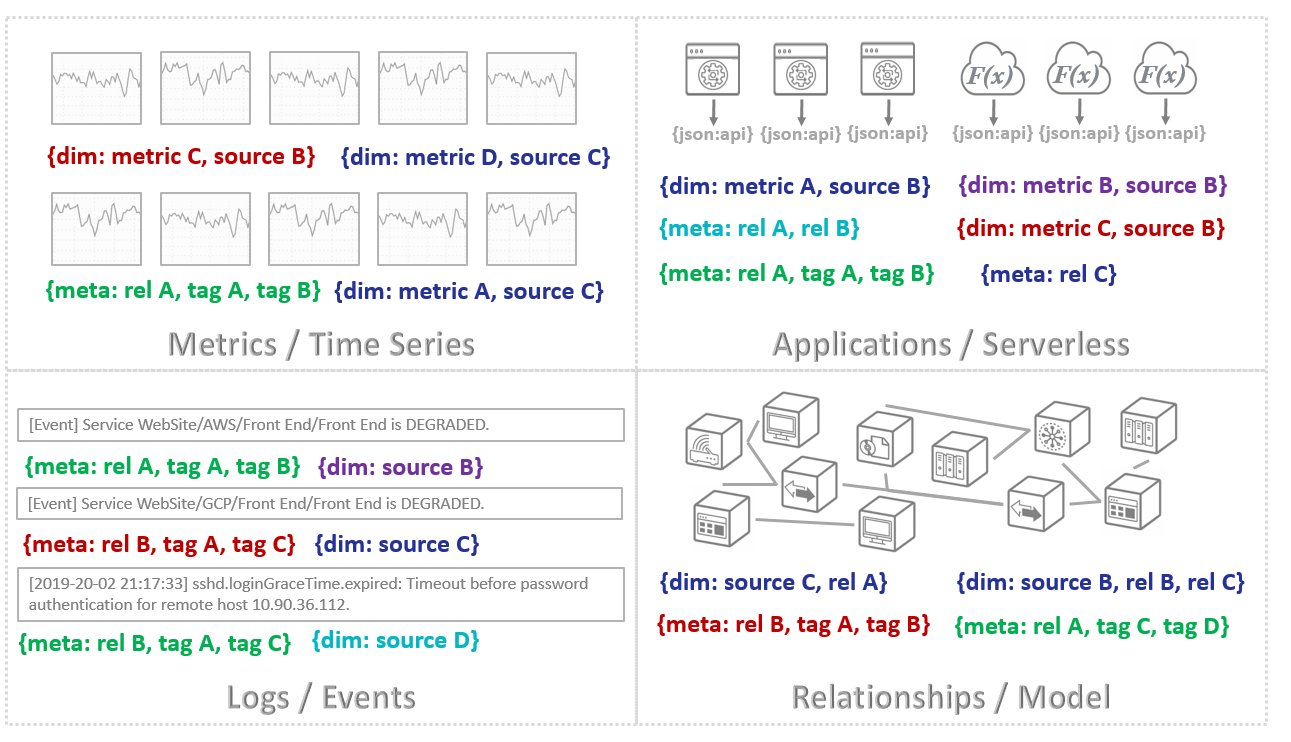
Recent entrants in the world of ITOM have been touting their ability to handle high-cardinality data, and to their credit, these tools have made a significant first step toward gathering hoards of machine data and providing troubleshooting capabilities for areas previously hard to reach. What makes high-cardinality data different than data often observed in classic dashboards is the incredibly large number of dimensions and associated metadata stored for every metric, log, event, etc. For instance, modern apps are comprised of millions of containers and serverless functions strewn across multiple clouds, and each one of these application components may exist for days or less than a second. Stitching all of this information together while trying to find outliers is magnitudes more difficult than trying to isolate a rogue Java thread on a typical application server.
Having the ability to ingest the raw values for all of this data is a feat not easily accomplished by traditional tools, which is why on-premises tools are being replaced with scalable cloud-based tools with regard to present-day applications. Even more complex are attempts to make sense of this ever-morphing hodgepodge by running queries against data with rapidly growing numbers of dimensions, where predefined indexes once provided relatively static alternatives for legacy databases. In short, absorbing, querying and providing insights for high-cardinality data is a must-have capability for operations management tools in the age of DevOps.
Zenoss Injects Key Components: Relationships and Time
Troubleshooting and debugging tools for modern applications are great for those with the luxury of maintaining purely cloud-derived applications, but for most enterprises, the operations landscape is much messier. The mix of DevOps-based applications are intermixed and often interdependent upon legacy applications and infrastructure. While merely querying across a relatively unassociated set of data can be helpful for investigative situations, knowledge of how application/service entities are composed in time is crucial to full-stack root-cause analysis as well as training machine learning algorithms to detect problems before they affect users.
Zenoss Cloud utilizes a patent-pending ingest/query engine allowing all types of operations data to be stored (and retrieved) with an unlimited number of dimensions and associated metadata. Combined with Zenoss Cloud’s ability to apply user-configurable policies, valuable metadata can be associated with streamed entities at collection, in transit via the data bus, or even after being stored. More importantly, changes to the entity metadata are tracked over time, which means changes to relationships and other valuable indicators are available for intelligent dashboards and machine learning algorithms. This powerful combination allows operators to manage legacy and multicloud applications while institutionalizing Site Reliability Engineering (SRE) practices across a common tool.
For more information on how you can utilize Zenoss Cloud to unify your observability practices across legacy and modern IT environments, contact Zenoss to set up a demo.

