Kubernetes was designed by Google in 2014 and has been maintained by the Cloud Native Computing Foundation since 2015. It has become the de facto standard for running containers in production at scale, including in cloud environments such as AWS, Azure and Google Cloud.
Kubernetes is a modern framework for managing and scaling containerized applications. There have been over 2.8 million contributions to Kubernetes made by companies. Along with containers, Kubernetes has emerged as a primary technology for modern cloud-native workloads. According to the Cloud Native Computing Foundation, organizations using or evaluating Kubernetes increased from 78% in 2019 to 96% in 2022.
The main benefits of application containerization using Kubernetes are:
- Scalability – Automatically provision or decommission containers to adjust to the demands of the applications, e.g., an e-commerce website.
- Availability and resiliency - Automatically restart containers that fail and reassign resources so that applications are always available.
- Resource optimization – Adjusting the use of resources such as CPU and memory in real time, ensuring critical compute resources are efficiently utilized.
Kubernetes provides the benefits of automation (e.g., managing updates, load balancing, self-healing), extensibility (with third-party tools), and strong community support. Also known as K8s, Kubernetes is supported by a community of professional developers from around the world.
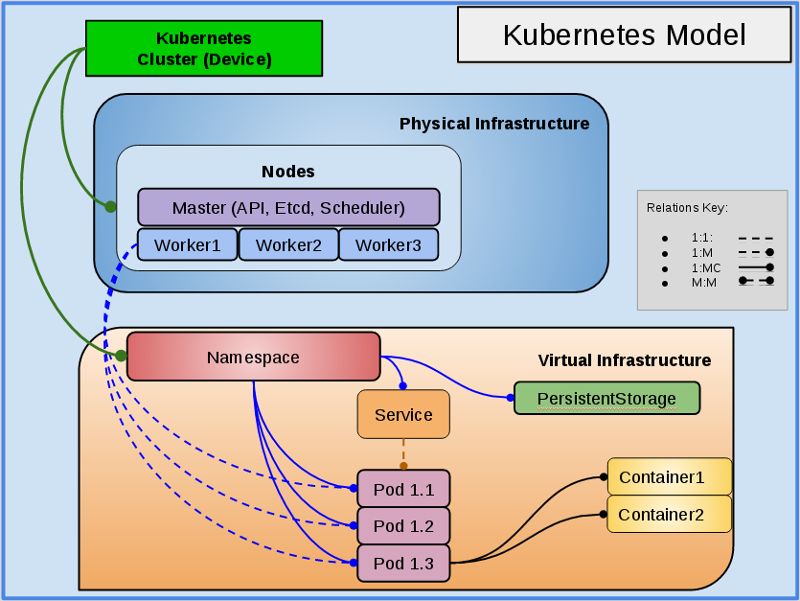
To fully realize the benefits, it is essential to monitor Kubernetes as a critical infrastructure element in a modern IT environment. A Kubernetes cluster is constantly changing as the framework continually adjusts resources to meet the demands of the applications running on it. (Kubernetes groups containers into logical units called "pods," which are scheduled onto "nodes," which are grouped in “clusters.” Nodes can be physical or virtual machines, and they provide the underlying compute, storage and networking resources required by the containers.
Given the dynamic nature of Kubernetes, continual real-time monitoring of cluster health and performance is essential for IT Ops and DevOps teams. These teams need the ability to drill down into the constituent components (i.e., containers, pods and nodes). This enables them to detect, understand and resolve issues such as resource limits, connectivity issues and application errors. There are various open-source as well as commercial tools that offer Kubernetes monitoring solutions, but there are significant differences in the depth of their capabilities.
Zenoss and Kubernetes: History
Zenoss has had a rich experience of supporting Kubernetes monitoring, including through open-source tools such as StatsD and Prometheus. However, while open-source tools come without licensing costs, the do-it-yourself approach has a few drawbacks:
- Maintenance and support - Kubernetes environments are very dynamic, and the framework itself is continually evolving. This means that organizations will need to dedicate their own personnel and resources to keep their monitoring systems up to date and available. In other words, the cost benefits of moving to a Kubernetes environment are often diminished by the maintenance and support burden.
- Point solution - A specialized Kubernetes monitoring solution means it is yet another tool for IT to monitor and audit, which just exacerbates the tool sprawl challenges most organizations face.
- No model information - A critical drawback of most tools (whether open source or commercial) is that they only collect metrics in isolation. They don’t provide additional context such as model information (how entities are related to each other). Without this model information, it is virtually impossible to perform root-cause analysis without significant manual effort.
Zenoss initially released its monitoring and analytics solution for Kubernetes in 2018. Since then, Zenoss has continued to offer solutions to customers with on-prem or cloud deployment options. Our newest solution (the cloud collector) is a natural evolution of our years of experience with Kubernetes combined with utilizing the full potential of Zenoss Cloud.
Zenoss Cloud Collector for Kubernetes
The Zenoss Cloud collector for Kubernetes, while building upon the capabilities of previous solutions, has three distinctions that make it appropriate for certain customer environments.
- No customer deployments - No download or installation is required; customers can begin monitoring in minutes without having to spin up dedicated collectors or agents.
- Expanded visibility - The new cloud collector supports additional metrics that help monitor and assess the health of a dynamic K8s environment and visibility for containers, pods and nodes.
- Multicloud powered by Zenoss Cloud - The collector provides a consistent way to monitor K8 deployments in public cloud environments in AWS, Azure and Google Cloud, as well as in private or hybrid clouds and on-prem environments. The collector automatically plugs into the rest of the Zenoss Cloud components and leverages capabilities such as Dashboards, SmartView, and Actions (for notifications).
Here's a deeper look into each of these areas.
No Customer Deployments
To set up Kubernetes monitoring, log in to your tenant environment as a Zenoss administrator and navigate to the Admin menu. Select the "Connectors" submenu from the left panel. You will be presented with a choice of connectors you can add to your environment, including Kubernetes, as shown.
Click "Add" and fill out any required fields, including credential information for the connector to connect to your Kubernetes environment.
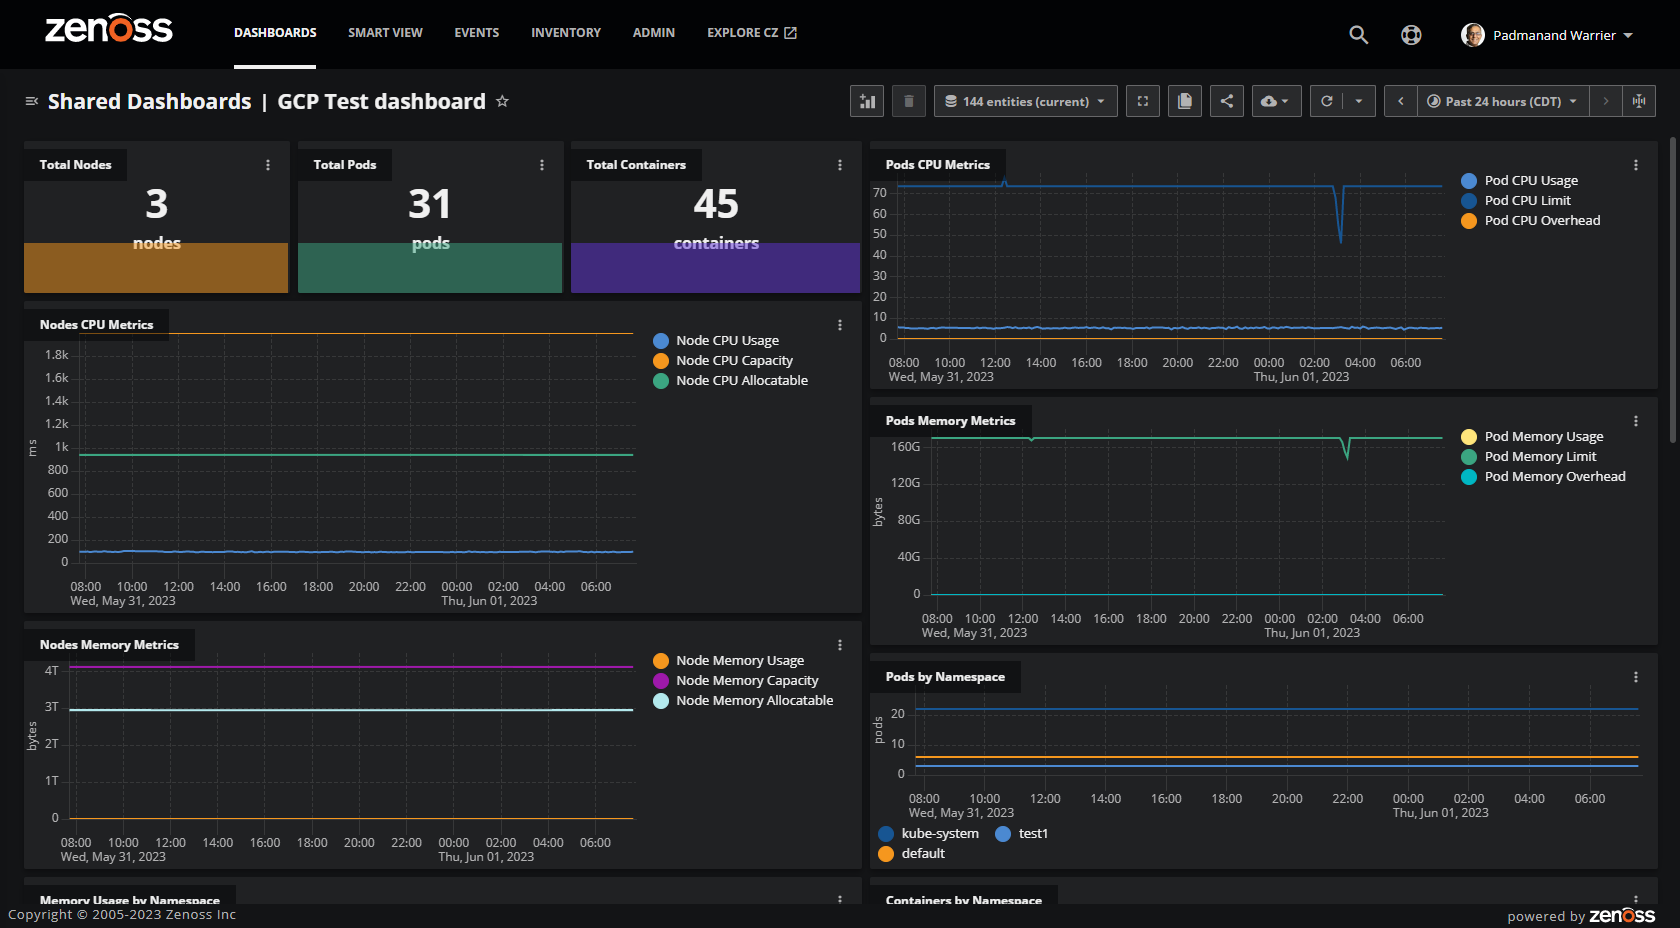
After you click the "Save" button and the configuration is verified, you will soon be directed to a dashboard prepopulated with tiles from a predefined template developed by Zenoss experts. The dashboard is automatically linked to the connector you just set up and uses the configured information to retrieve data from your Kubernetes environment. You should be able to see a fully populated dashboard within a few minutes of setup.
Here is an example:
Note that you can always go back and edit your configuration to make changes if desired. You can also customize your dashboard to suit your needs and preferences, including rearranging the tiles or adding new ones.
Expanded Visibility
In addition to the metrics supported by the Zenoss Kubernetes ZenPack, here are some of the additional metrics and metadata included in the Zenoss Cloud collector for Kubernetes:
Cluster
- k8s.cluster.unhandledevents.total.sincestart
Node
- Additional metadata fields such as createdTimestamp, nodeReady, nodeMemoryPressure, nodeDiskPressure, etc.
Pod
- K8s.pod.overhead.cpu.cores
- K8s.pod.overhead.memory.bytes
Deployment
- k8s.deployment.replicas.rollingupdate.max.unavailable
- k8s.deployment.replicas.rollingupdate.max.surge
- k8s.deployment.replicas.desired
Container
- k8s.container.status.restarts.total
Stateful Set
- k8s.statefulset.generation.observed
- k8s.statefulset.replicas.updated
- k8s.statefulset.replicas.available
- k8s.statefulset.replicas.ready
- k8s.statefulset.replicas.current
- k8s.statefulset.generation
For example, the tile below shows the desired deployment replicas match the ready deployment replicas, which confirms the deployment status is as intended.
Multicloud Powered by Zenoss Cloud
Here is an example of using the "tabbed dashboards" feature of Zenoss Cloud to view Kubernetes environments on AWS, Azure and GCP. The default templates for all three are the same, so you can easily switch between the tabs to compare the information in a consistent way.
Or, if you prefer, you can also create a consolidated "overview" dashboard to showcase the information across all three. Note that "copy to dashboard" is a time-saving feature that allows you to quickly copy a tile from one dashboard to another. This will allow you to easily set up a consolidated dashboard with only the critical tiles you need. For example, you might want to view the events across all environments so you can drill down into the underlying SmartView as needed.
Here is an example of what the SmartView looks like:
Other Zenoss Cloud capabilities, such as the "Actions Framework" to set up triggers and notifications, are also immediately available. In sum, you can leverage the full power of Zenoss Cloud to monitor Kubernetes environments across a variety of deployment options.
How To Get Started
It's easy to get started. Just sign up at this link and fill out your contact details on the form for a free trial — no credit card required!
Your information will be utilized to set up a trial instance in Zenoss Cloud to host the collector for your Kubernetes environment. After you hit "Submit," you will receive an email within a couple of business days with instructions to log in and set up your environment. Setup is easy as described above. Once you provide your configuration information, Zenoss will spin up a collector in your tenant behind the scenes. Within a few minutes, you can monitor your environment via the dashboard template prepopulated with your configuration details.
