One of the great things about buying my first house was the two-car garage. Sure, it was nice to not have to share a wall with the people in the next unit. Having a backyard, however small, was terrific. Not worrying about being shocked every time I turned on the electric stove was a relief. But having an honest-to-goodness covered structure in which my wife and I could park both of our cars was ... well, it was fantastic. Never again would we have to carry groceries through the rain from the apartment complex’s parking lot. There was even some extra room in there for storage. It was everything we needed!
Until it wasn’t. One day, I realized that between the bikes and the skis and the lawn mower and the shop vac and the baby stroller we no longer used and who knows what else, it had become a challenge to get from the garage door to the car. My garage was at maximum capacity. I needed to get rid of a bunch of stuff, or find some other place to store it. This is a problem that is familiar to most homeowners.
It is also a problem familiar to most IT operations managers. It is no secret that many enterprises double their storage capacity utilization every 24 months or less, and the continuing movement to the cloud hasn’t put much of a dent in that trend. But it’s not just storage capacity utilization that is growing. All of those VMs that get spun up eat more and more server CPU and I/O bandwidth. Additional applications put an ever greater load on the network. As video and other streaming applications become standard business tools, network uplinks get saturated. And if you’ve opened up your shop to BYOD, well, you are probably on a first name basis with your network equipment salesperson.
Of course, a good unified monitoring tool will help you keep tabs on your utilization, in terms of both capacity and performance. Zenoss Service Dynamics offers a rich set of graphs and reports that will give you not just a current view of your storage, network, or CPU utilization, but a historical look-back at utilization over time.
However, while valuable, that snapshot isn’t enough to proactively manage your utilization. As one customer told us, “What I really want is for someone to tap me on the shoulder a couple of months before I run out of capacity so that I can provision new capacity into my infrastructure, or get new hardware through the procurement process.”
Trendlines
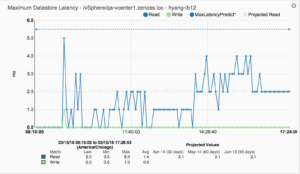
Zenoss Service Dynamics 5.1 provides tools to do just that. The new Predictive Thresholds ZenPack offers the ability to overlay trendlines on graphs. These are powerful visual indicators of how rapidly resource consumption is growing. The trendline will project continuously into the future, which can be seen simply by moving the focus of the graph. And the graph legend shows the predicted utilization 30, 60, and 90 days out.
It also enables administrators to set a new kind of threshold, the Predictive Threshold. Predictive thresholds are really just MAX (and/or MIN) thresholds keyed to the trendline. Not only can admins see the trendline on a graph, they can follow the trendline to see when it is likely to cross the defined threshold.
Predictive Thresholds
Of course, an event will be raised when the actual utilization crosses the threshold. Even more useful, from a capacity planning perspective, an event can be generated hours, days, or weeks before that threshold is expected to be reached, based on the current trend. The amount of historical data used to calculate the trend and the amount of time an event is raised in advance of the predictive threshold being reached are both configurable. The more historical data used to calculate the trend, the less susceptible the trend will be to ‘noise’ created by anomalous events.
Currently, utilization trends are based on linear regression using the defined amount of historical data. In the future, we’ll add additional algorithms to this, including the popular Holt-Winters exponential smoothing algorithm that can account for seasonality in trends and spot deviations from normal operating behavior.
Managing growing capacity utilization is tricky. Predictive thresholds and trendlines can be a powerful tool to help determine when it is time to move workloads, add capacity, or procure new hardware.
Or move to a house with a three-car garage.
Over the next few weeks, we’ll be bringing you posts that focus on other exciting new features of Zenoss Service Dynamics, including Component Groups and Dependency Views.
Interested in learning more? Enter your email address below to subscribe to our blog!


